
Driver scoring and driving analysis
Understand driving patterns and compare performance in context.
How is the driving score calculated?
KPI (Key Performance Indicators — measures of driving performance) link recorded events to configurable scoring rules. In the ZAINN application you can create scoring profiles and define the points deducted for each event.
Set thresholds for your fleet
Speeding can be split into three bands: low, medium and high. Set thresholds relative to the available road speed limit with a percentage tolerance, or use a fixed speed limit. Configure the points deducted and display colour for each band.
Results that are easy to read
RAG (Red, Amber, Green — a colour-coded performance rating) provides a quick overview of driving results. Green indicates strong performance, amber highlights room for improvement and red calls for closer review. Rating boundaries are configurable. The vehicle/driver KPI report shows event counts and supports comparisons between selected vehicles or drivers.
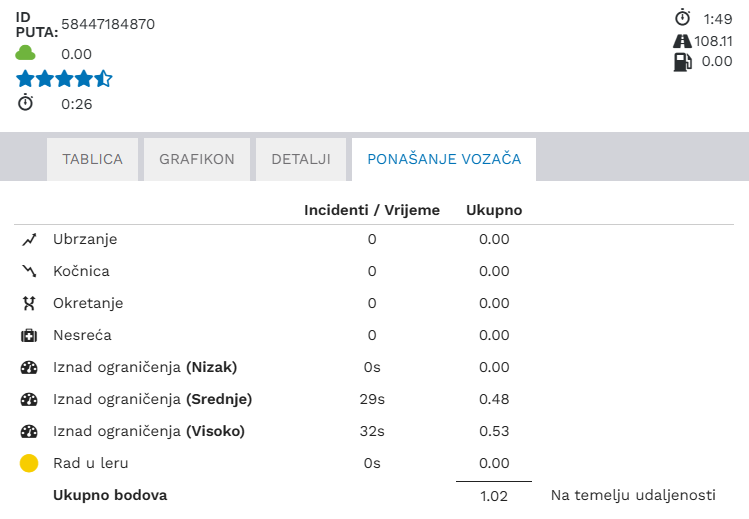
The driver behaviour view shows acceleration, braking and cornering events, speeding bands and idling where data is available. Event counts or duration are shown alongside their contribution to the total points. This example uses a distance-based calculation. Interpret stars, points and colour boundaries according to the configured profile.
Use the score to guide discussion and monitor progress. Compare similar routes, vehicle types and operating conditions; available events depend on the device and configuration.
Review driving events
Supported equipment can record harsh braking, acceleration, cornering and idling. Events and scoring depend on device capabilities and settings.
Use comparisons fairly
Consider vehicle type, route and working conditions when comparing trips or drivers. Use trends to guide conversations and follow progress over time.
Eco driving and engine idling
Eco driving starts with specific events: harsh acceleration, braking, cornering and engine idling. With suitable equipment, review them alongside fuel data. This helps identify recurring patterns and discuss practical changes with drivers, comparing vehicles on similar routes and assignments.
Compare similar vehicles and similar tasks
A score is more useful when the comparison accounts for working conditions. Urban deliveries with frequent stops differ from a long open-road journey. When reviewing events, check vehicle type, route, task duration and available engine-operation data. Complement the overall score with specific situations that the responsible person can investigate and discuss with the driver in the context of the work performed.
Review the change after an agreed action
After a discussion with the driver, select the same event type and a comparable period for the next review. For example, check recurring harsh acceleration or recorded idling duration where the device supports them. This makes it possible to assess changed behaviour through actual records. Evaluate consumption using suitable fuel readings and a comparison that accounts for how the vehicle was used. This lets you assess driving behaviour and fuel consumption separately.