
ZAINN GPS platform overview
Select an image to enlarge.
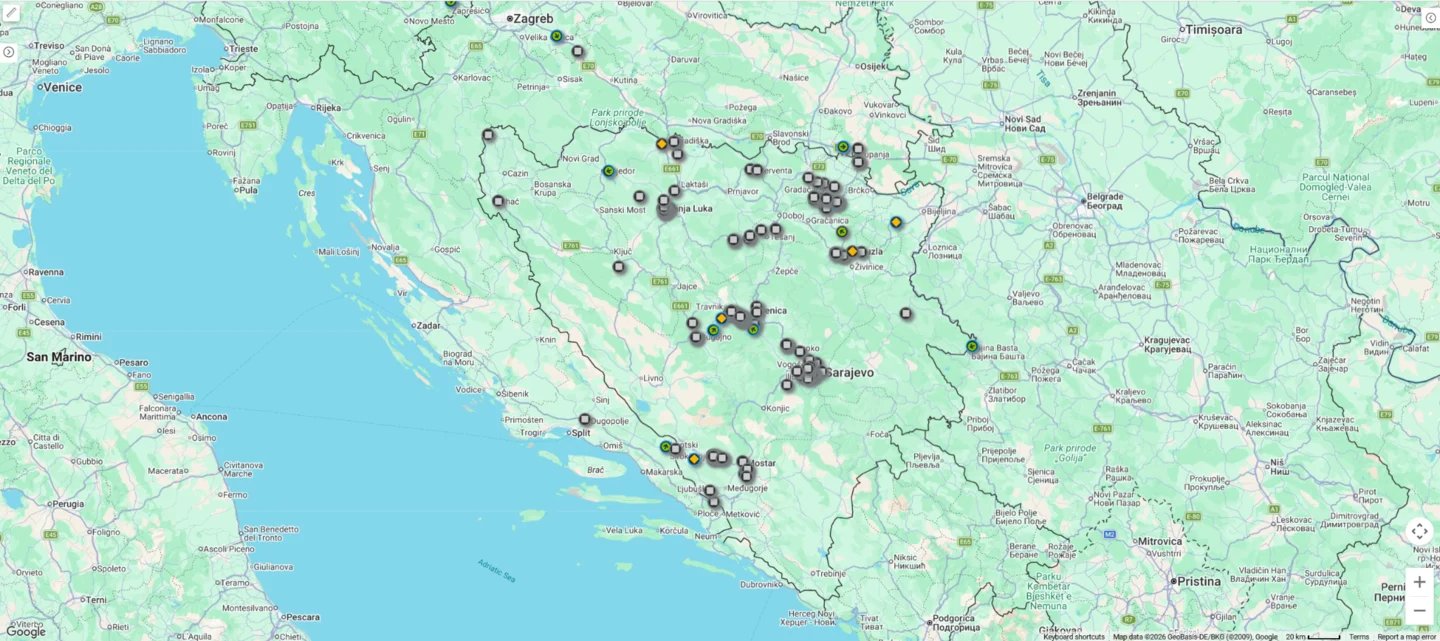
Compare useful fleet data
Bring supported vehicle readings into a single overview and compare vehicles over selected periods.
Activity maps and sensor charts
Where supported, heatmaps show areas of activity, while dual-axis charts compare two readings over time. Available indicators depend on data and package.
Start with the decision you need to make
A dashboard is more useful when you know what you are checking: vehicle use, unexpected waiting or a change in an available sensor reading. Agree who monitors each indicator and when a detailed review is needed. The summary highlights a difference; the reason is checked in the underlying data. This turns a fleet overview into the start of a practical workflow.
Check the period and data freshness
Before comparing results, confirm the same time range and the appropriate vehicle group. Check when data was last recorded and whether the vehicles provide different readings. A vehicle without a supported sensor should not be treated as having no consumption or events. If a summary is insufficient, open the relevant report or history and check what was actually recorded.